Read the routing plan: ETAs, distance, load
By Nathan ColeUpdated
After an optimization, the Optimize page shows the routing plan at three levels: the whole plan (the metrics strip), each vehicle's day (the route cards), and each stop (the stop rows). This page covers each level in that order.
The examples use the ready-made Time windows plan. Load it to work from the same data:
The metrics strip: the whole plan in one line
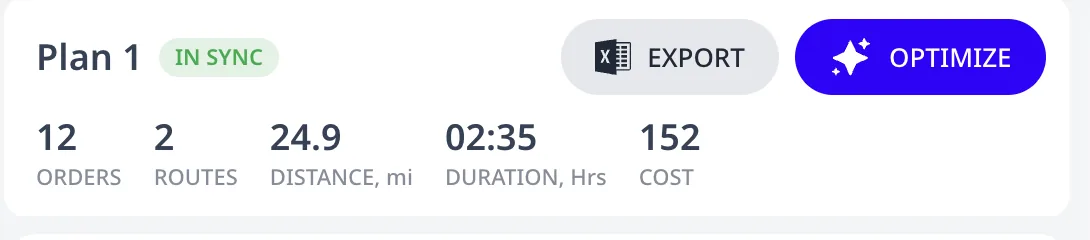
The metrics strip across the top of the page shows:
- ORDERS: how many orders the plan contains.
- UNASSIGNED: shown in red only when at least one order cannot be served. Click into the red panel below for the reasons. See Why an order went unassigned.
- ROUTES: how many routes the plan uses. When any vehicle reloads at a depot mid-day, this becomes ROUTES / TRIPS.
- DISTANCE, km (or mi): total driving across all routes.
- DURATION, Hrs: total working time across all routes.
- COST: the plan's total cost under your vehicle cost model. See Vehicle costs and the COST metric.
- # PROBLEMS: shown only when the routing plan contains constraint violations, usually after manual edits. See Problems and warnings, explained.
- TIME LEFT: countdown, only while an optimization is running.
Route cards: one vehicle's day
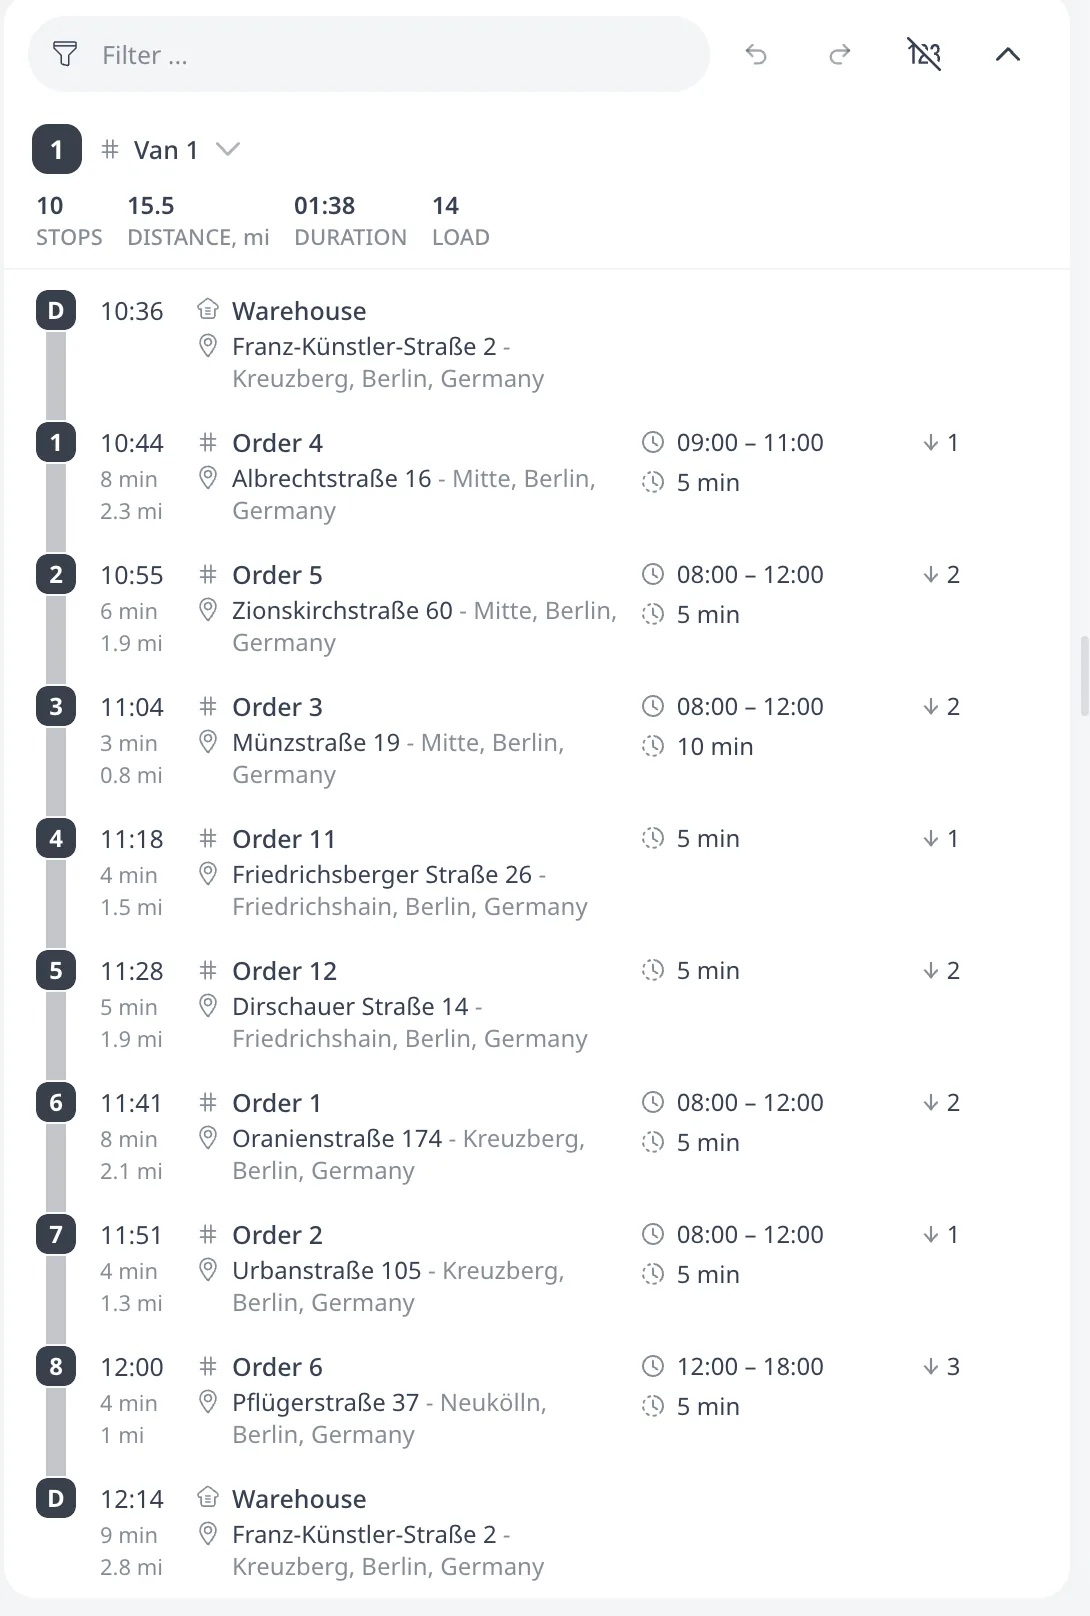
Each route gets a card with its color swatch and vehicle id, plus a row of per-route stats:
- STOPS: how many stops the route visits.
- DISTANCE and DURATION: this route's share of driving and time.
- LOAD: the total load delivered on the route.
- PROBLEMS: in red, only if this route has violations.
The card header also shows the route's actions: Share route, show or hide this route on the map, isolate it (zoom to this route alone), and the route actions menu used for editing routes by hand.
Stop rows: what happens at each stop
A card lists its stops in visiting order. Each row shows:
- The stop number in route order. A D marks the depot at the start and end of a route.
- ETA: when the vehicle arrives, plus the travel time and distance of the leg from the previous stop.
- The order id and its address.
- The order's rules where they apply: time window, service duration, release time.
- The load delivered or picked up at the stop.
Two kinds of annotation can appear under a stop:
- A red problem line flags a constraint violated at this stop, for example "Misses a delivery time window by 12 min". Problems and warnings, explained covers each message.
- A blue line like "Waits 25 min for the window to open" means the vehicle arrives early and idles. A wait is not an error, but long waits indicate that a window or the shift start could move. On the tutorial plan above, the morning and afternoon windows produce visible waits.
Trip dividers
When a vehicle returns to a depot to reload mid-route, the stop list shows a divider: ↻ Trip 2, with that trip's own distance. Everything below it belongs to the second trip. Multiple depots, open routes, and reloads covers reloading.
Decluttering a big routing plan
Three controls change what the list shows:
- The filter box above the routes narrows the list to matching orders and routes.
- Show/Hide all statistics collapses the per-route stat rows. Each card also has its own toggle.
- Show/Hide all stops details collapses the per-stop detail lines to bare rows. The same toggle exists on each route card.
Hiding details does not change the routing plan, only the display. For map-side reading, see the isolate and layer controls in View a single route vs. all routes.
Next step
If the numbers look right but a stop is in the wrong place, see Edit routes by hand: drag, split, merge.
FAQ
What does the metrics strip at the top show?
The strip totals the whole plan: how many orders it contains, the unassigned count in red when at least one order cannot be served, the routes and trips, total distance, total duration, and the total cost under your vehicle cost model. A problems figure appears only when the routing plan contains violations.
What does each stop row on a route card show?
Each row shows the stop number in route order, with a D marking the depot at the start and end, then the ETA plus the travel time and distance of the leg from the previous stop, the order id and address, the order's rules where they apply, and the load delivered or picked up at the stop.
What does the blue waits line under a stop mean?
The vehicle arrives before the order's window opens and idles until it does. A wait is not an error: the plan is valid and the wait is part of the route's working time. Long waits on one route indicate that a window or the shift start could move.
What is a trip divider in the stop list?
When a vehicle returns to a depot to reload mid-route, the stop list shows a divider labeled Trip 2 with that trip's own distance, and everything below it belongs to the second trip. The ROUTES metric becomes ROUTES / TRIPS when any vehicle reloads at a depot mid-day.